
Help centreSimulation
Run a static stress study
A static stress study tells you how far a part moves under a steady load and where it is worked hardest. Give it a material, hold it somewhere, push on it, and solve.
-
With the model open, pick Simulation on the top bar. The study has the part's material and its properties; it still needs to know where the part is held and what pushes on it.
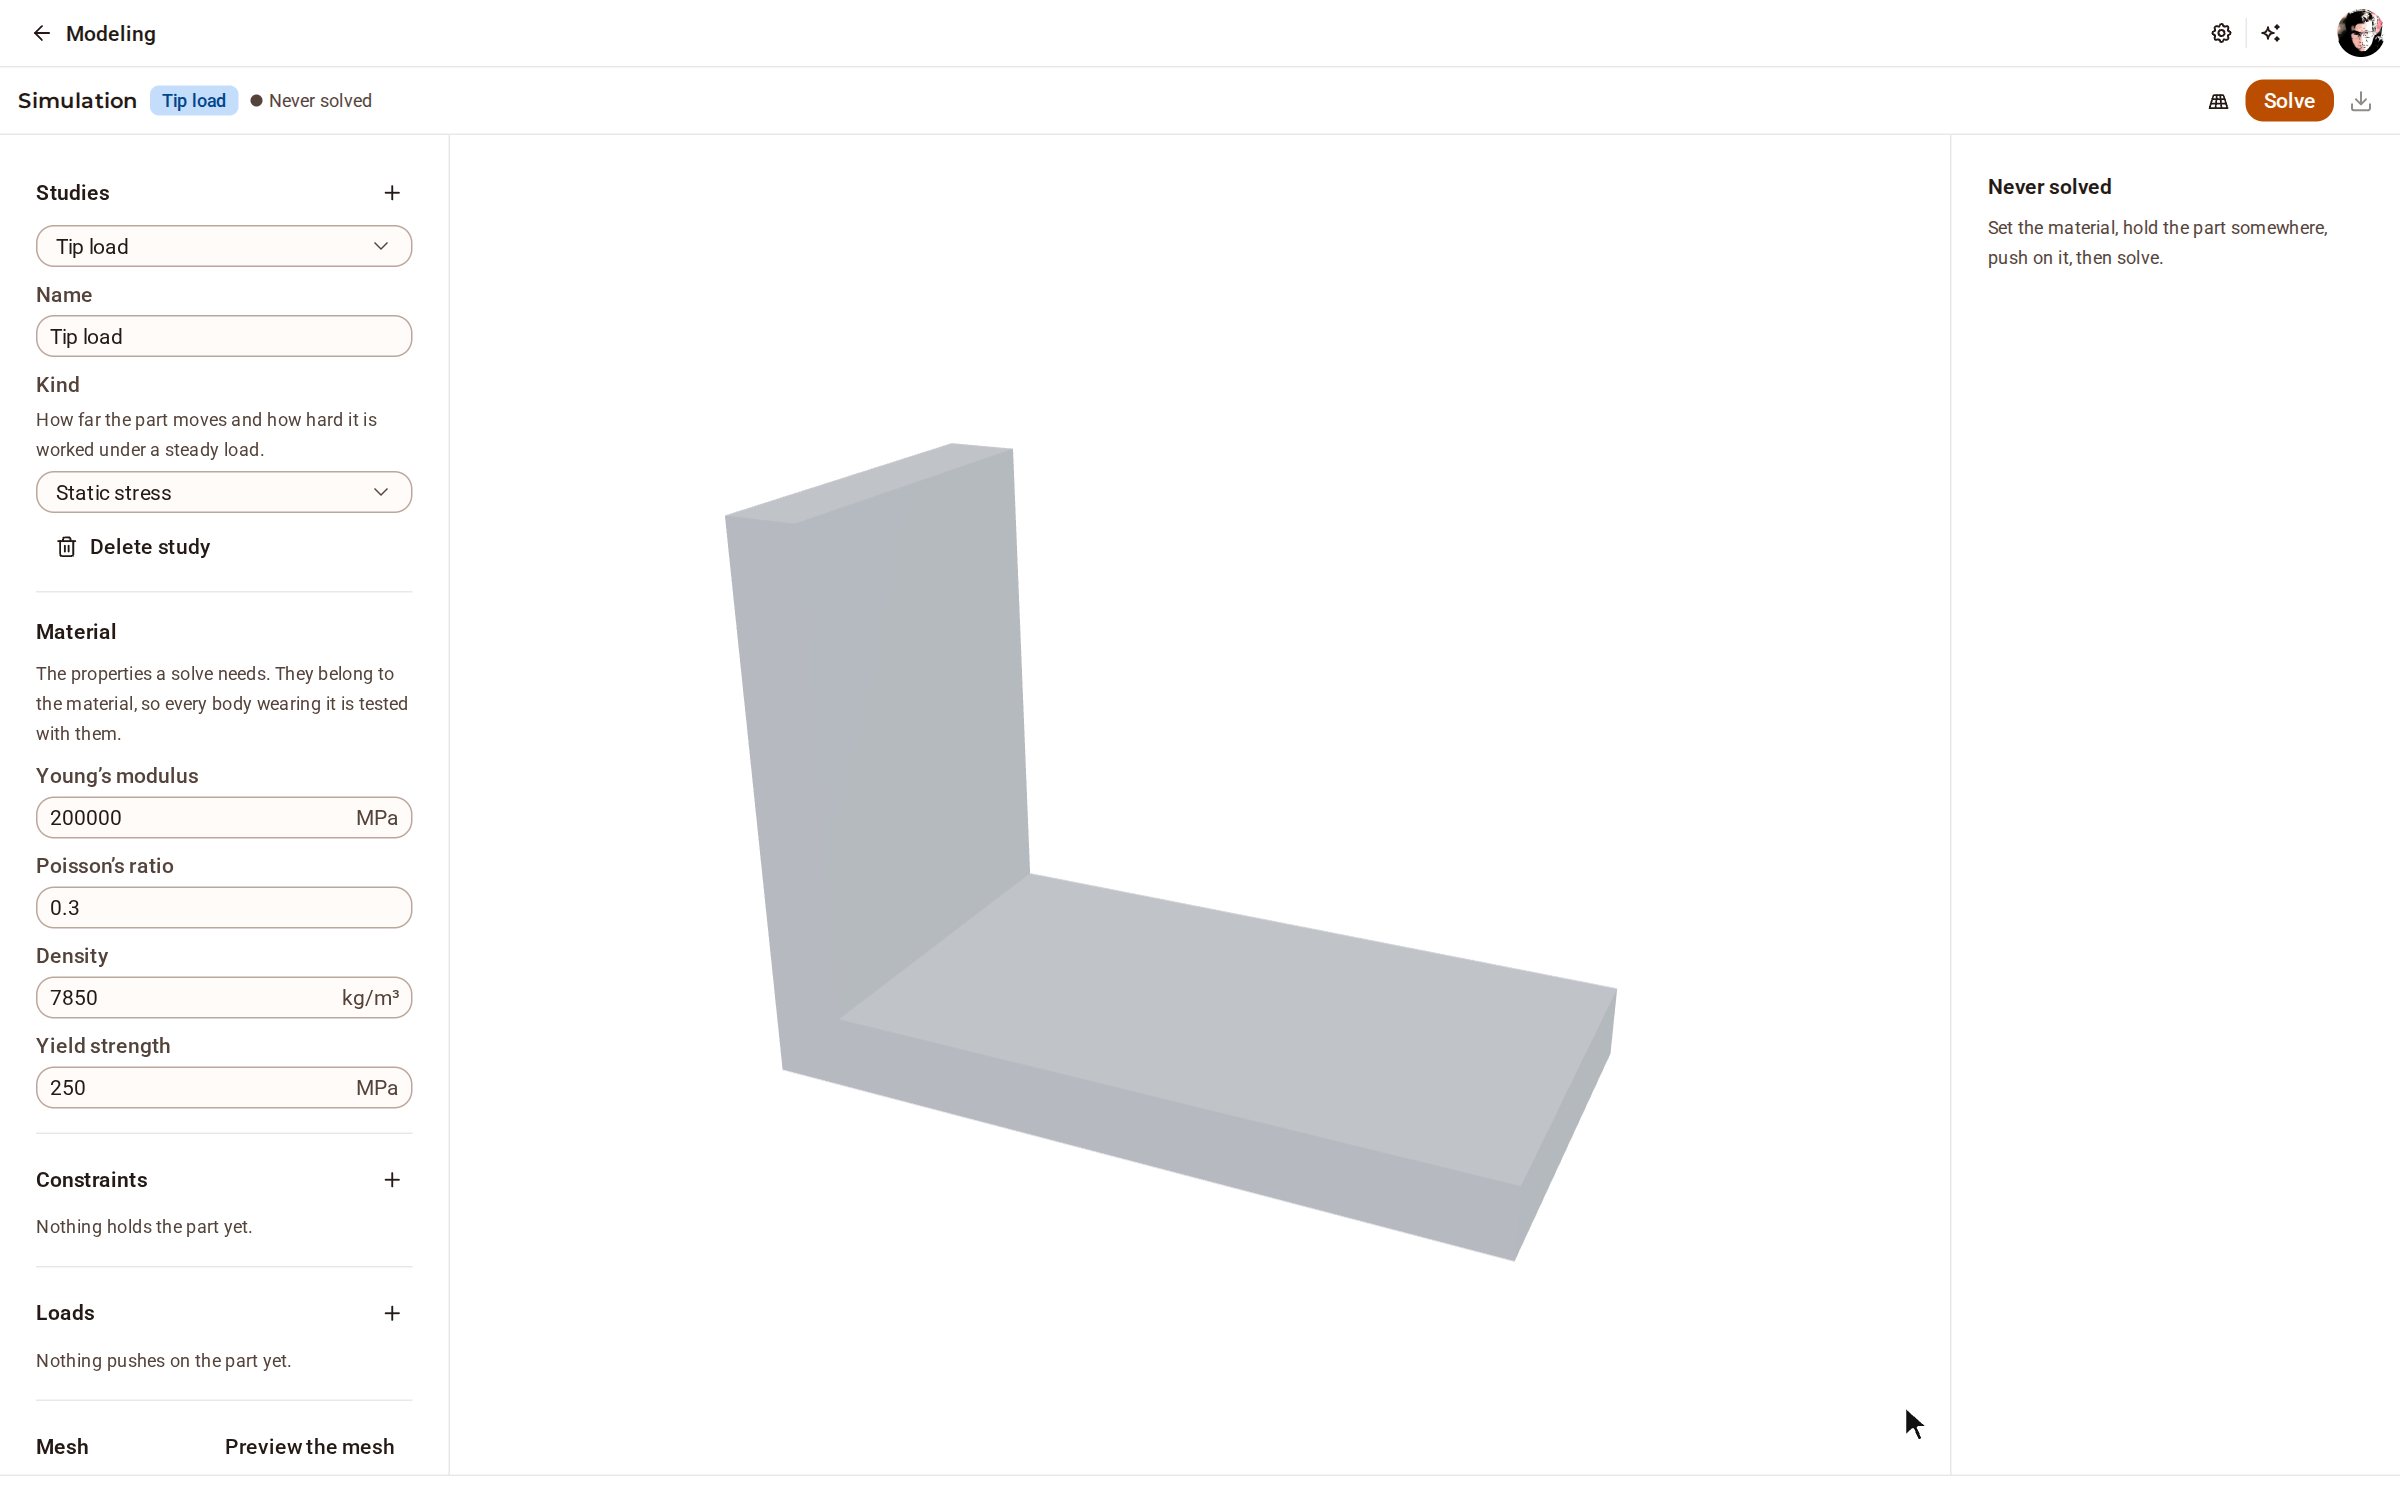
-
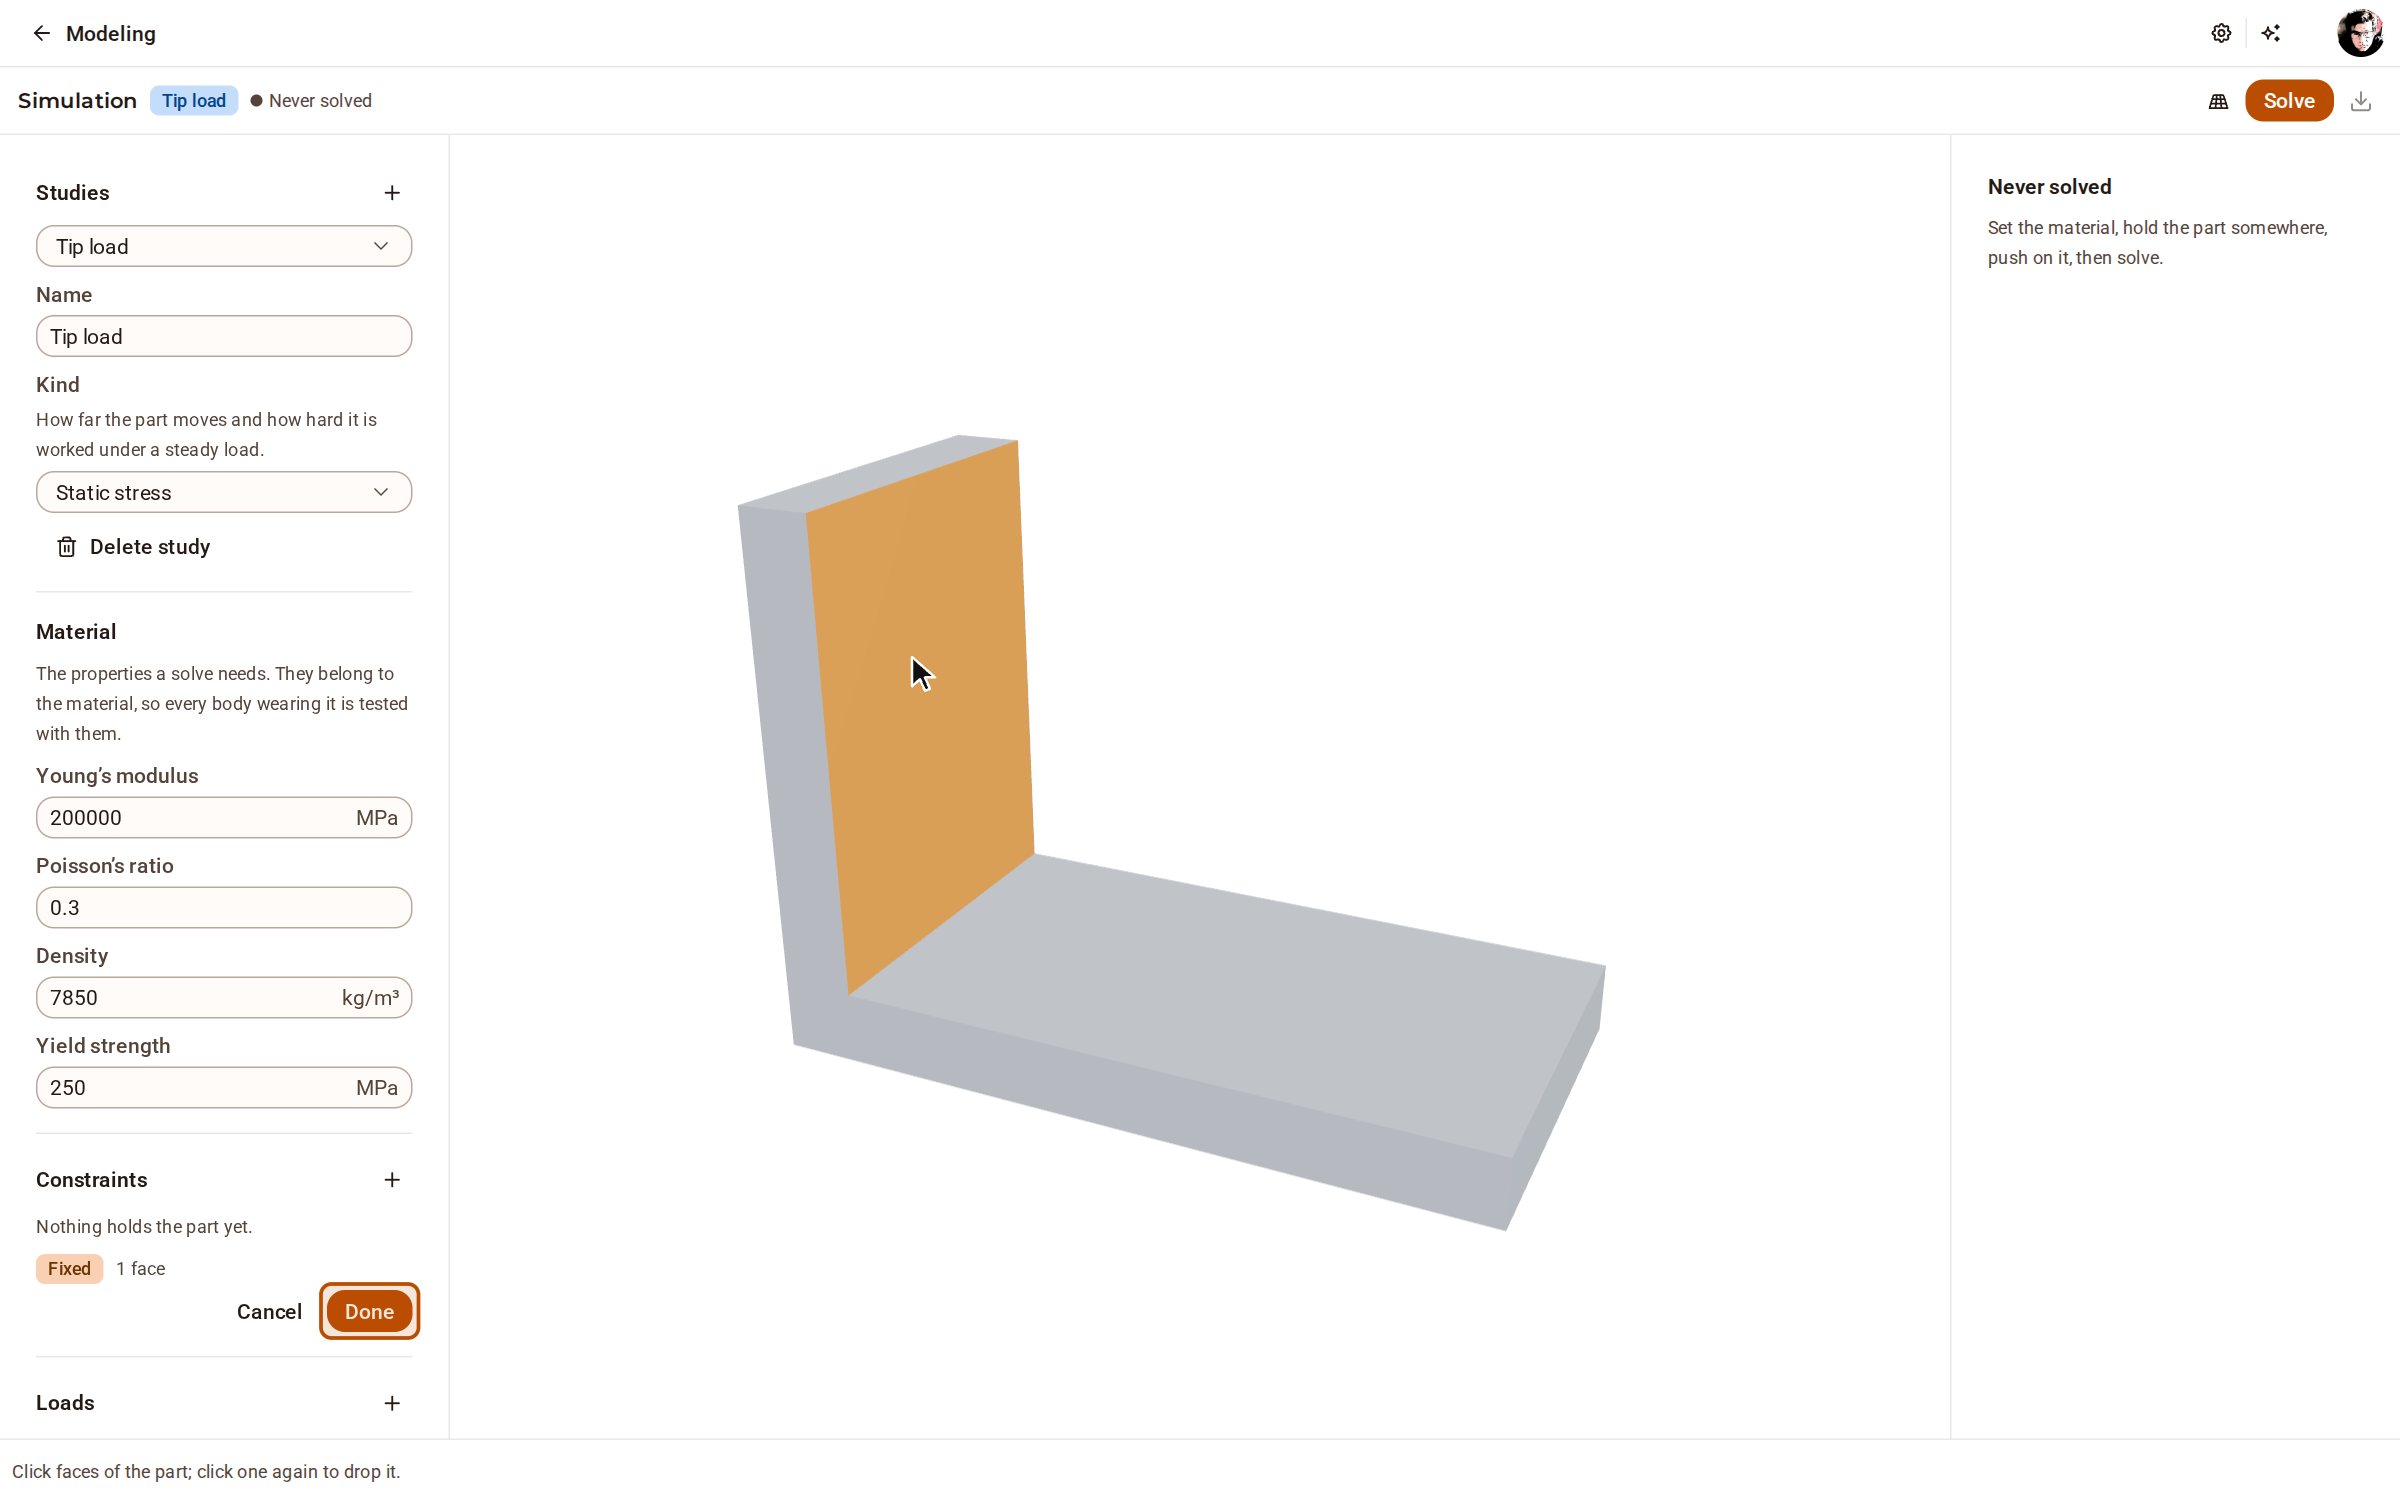
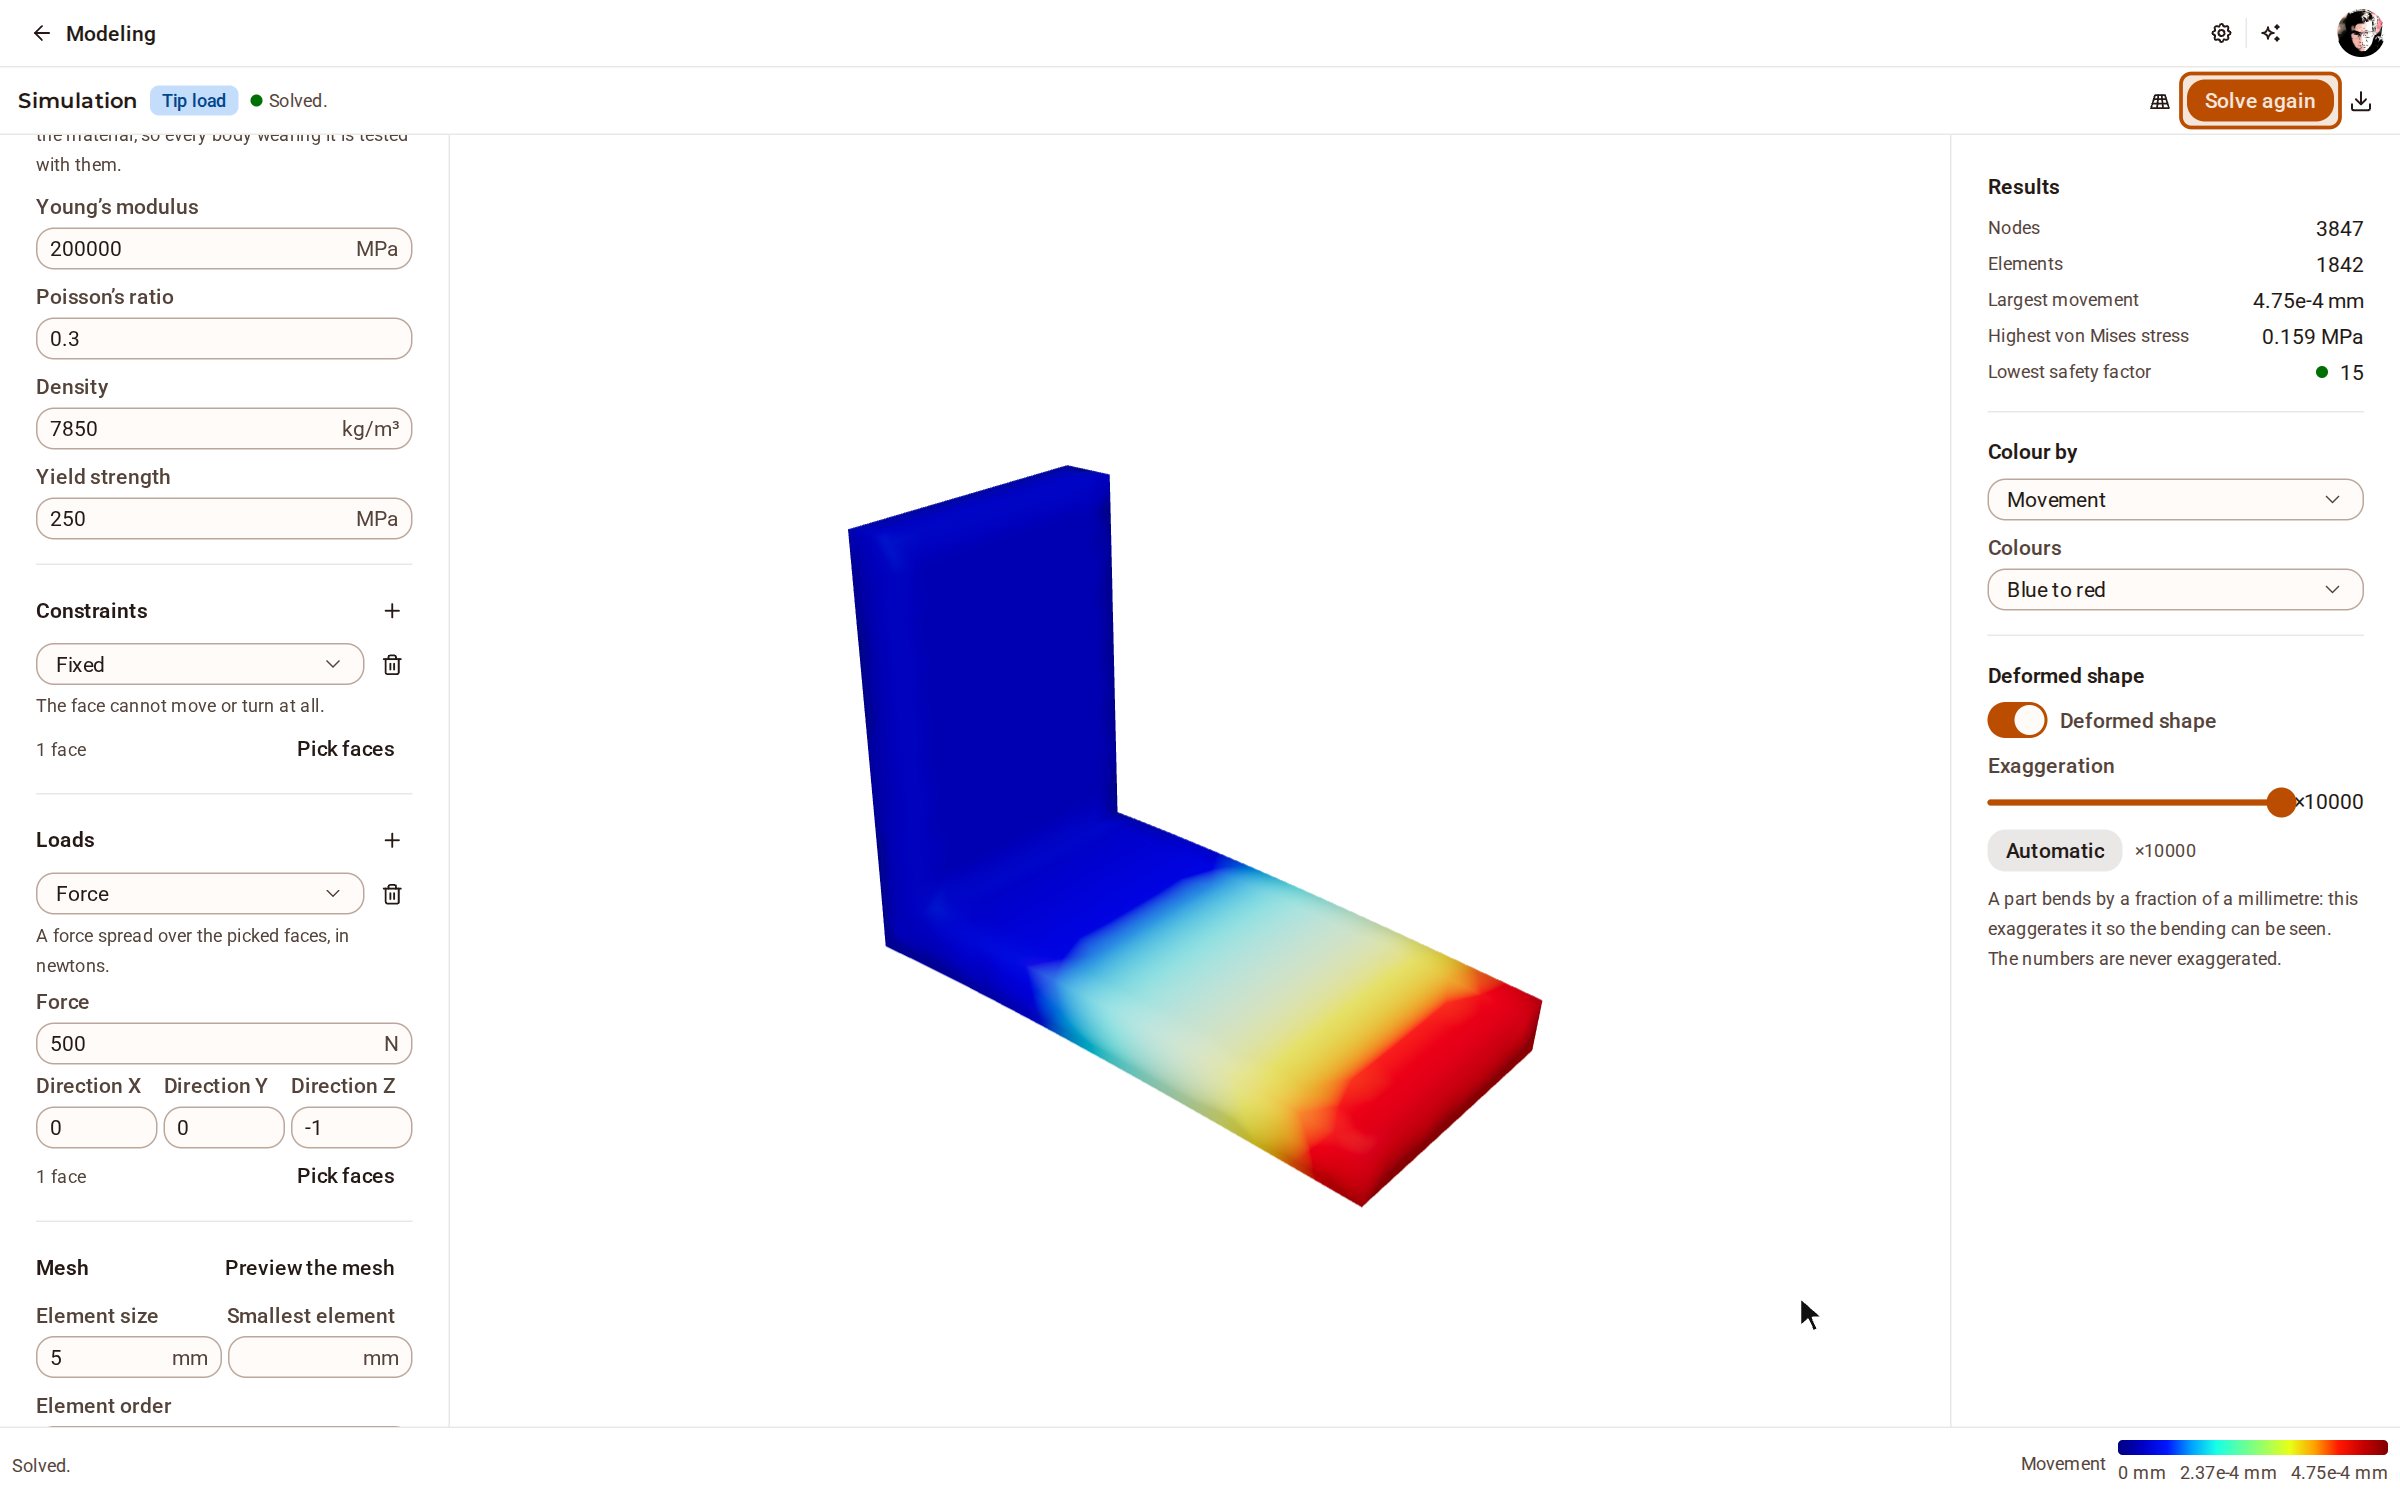
Under Constraints, click + and choose Fixed. Click the face that is held — here the inner face of the upright — and it lights up. Click Done.
-
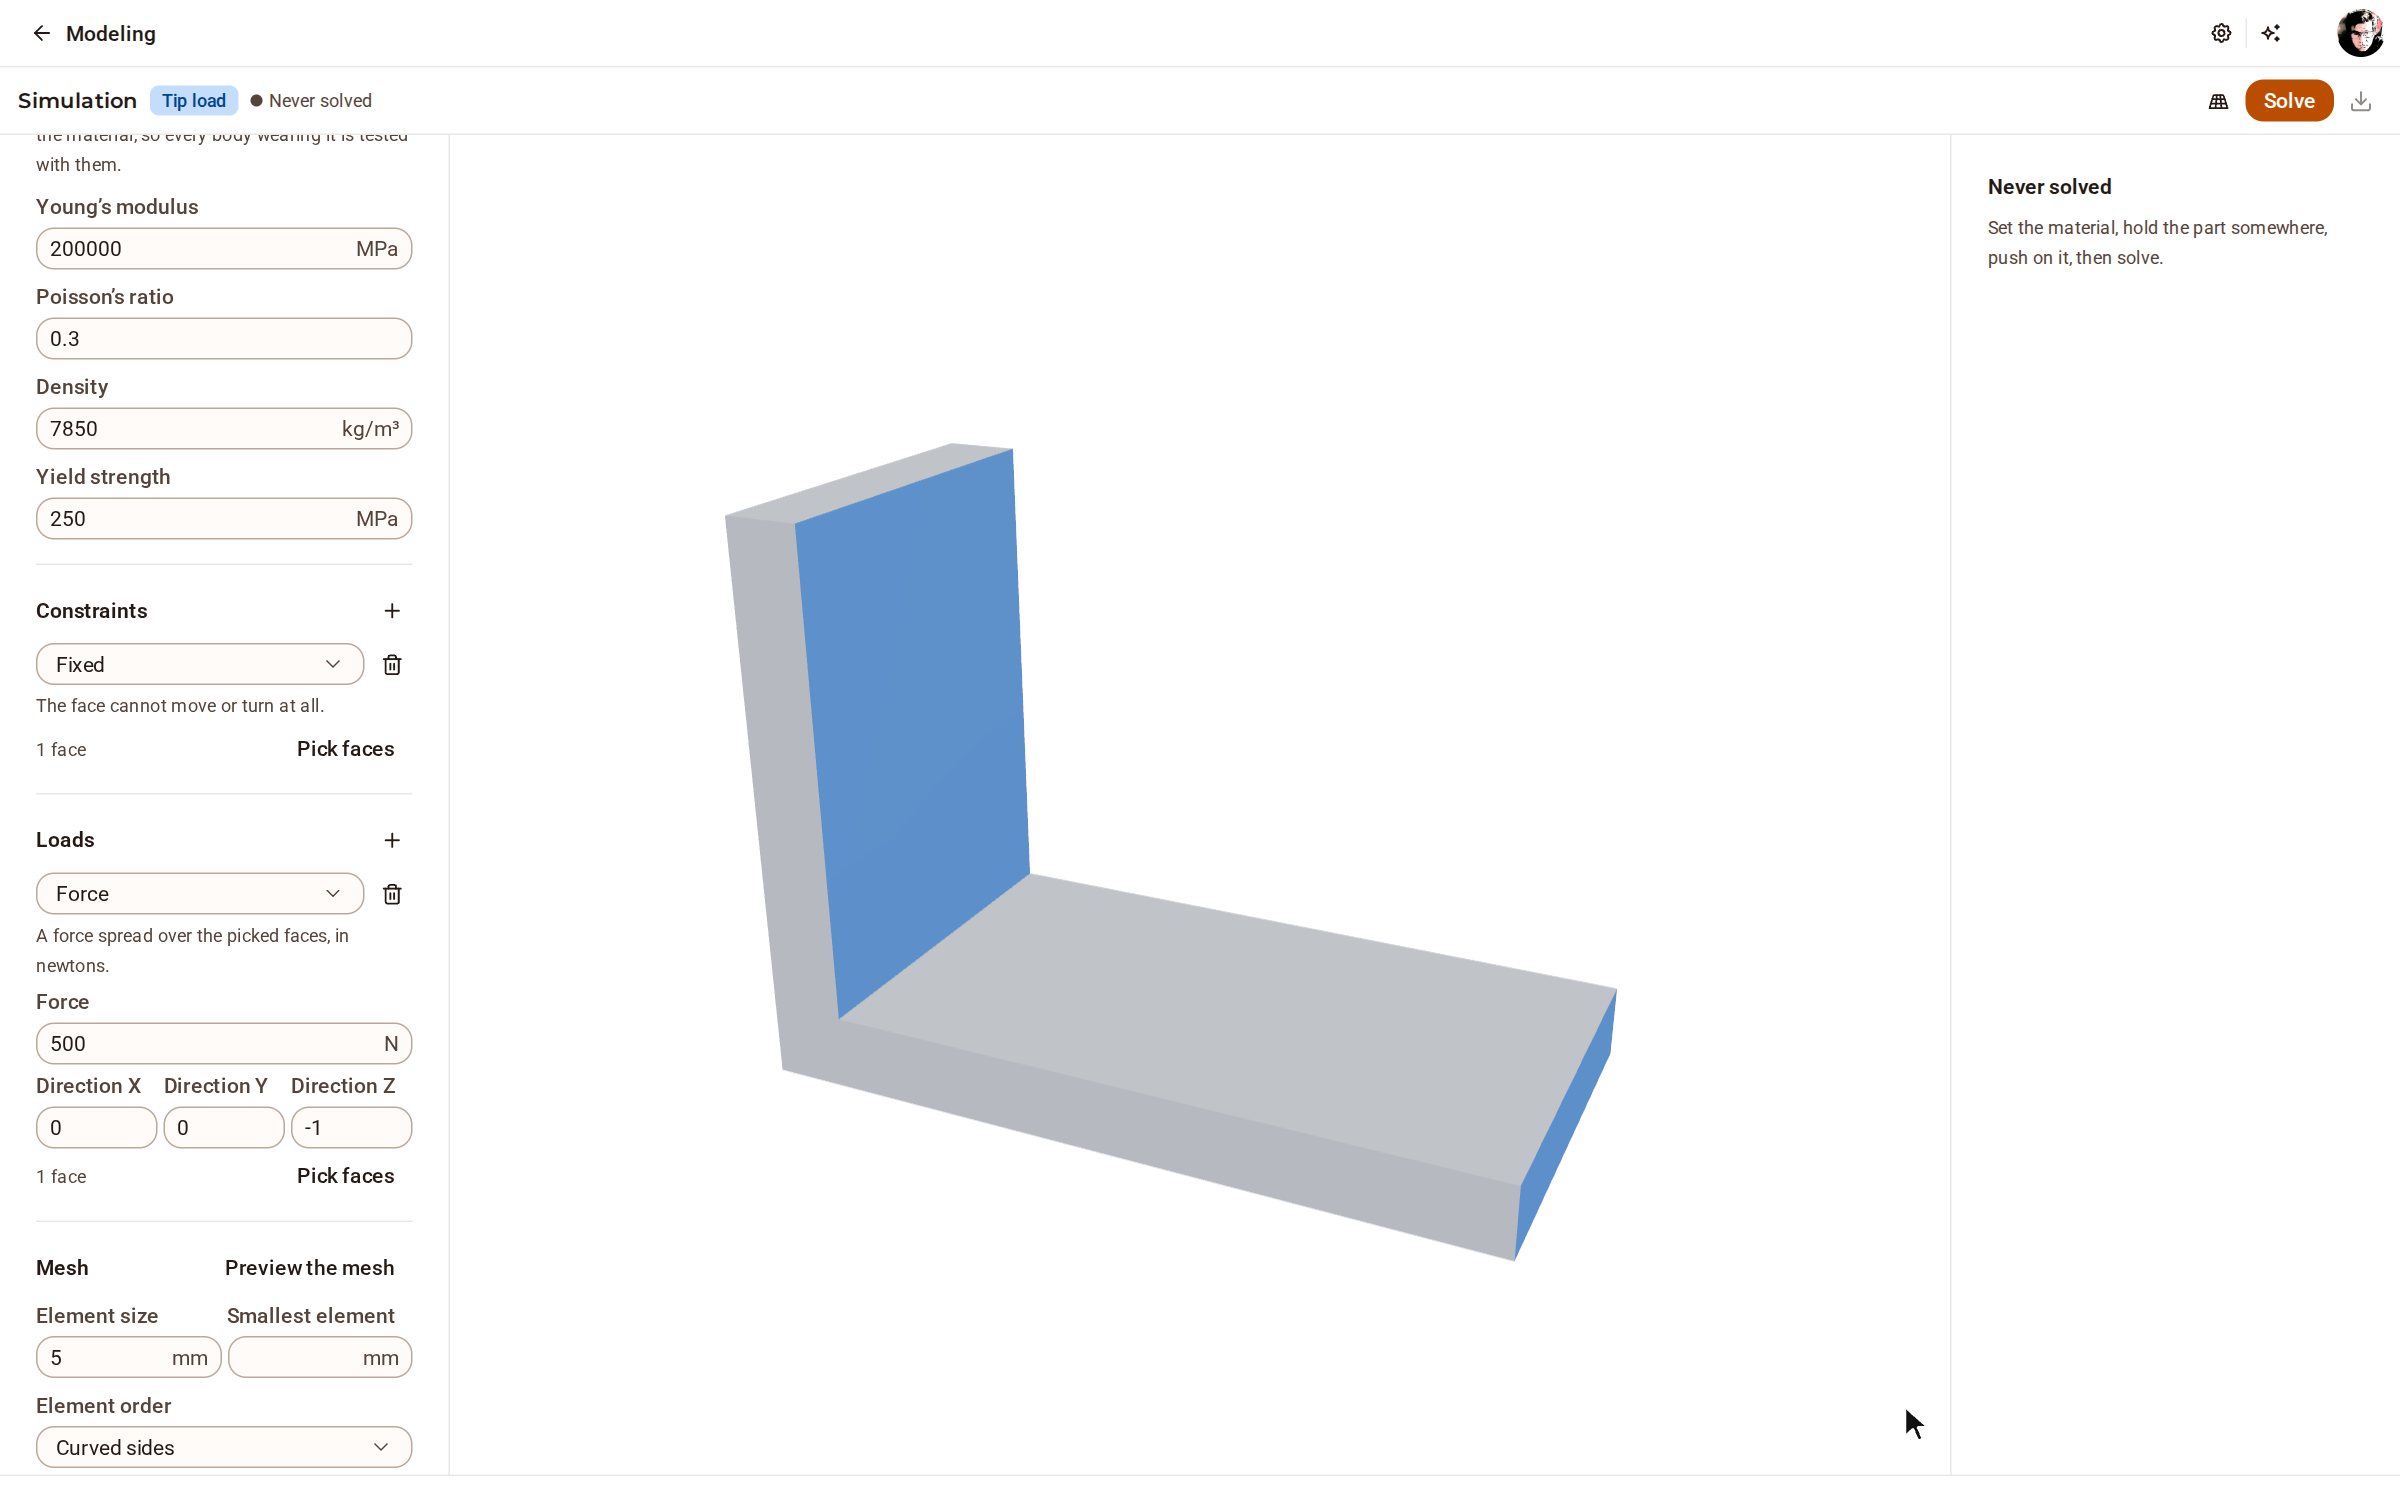
Under Loads, click + and choose Force, click the tip of the arm, then Done. Type the force in its Force field — here 500 N — and press Enter; it points down unless you change its Direction.
-
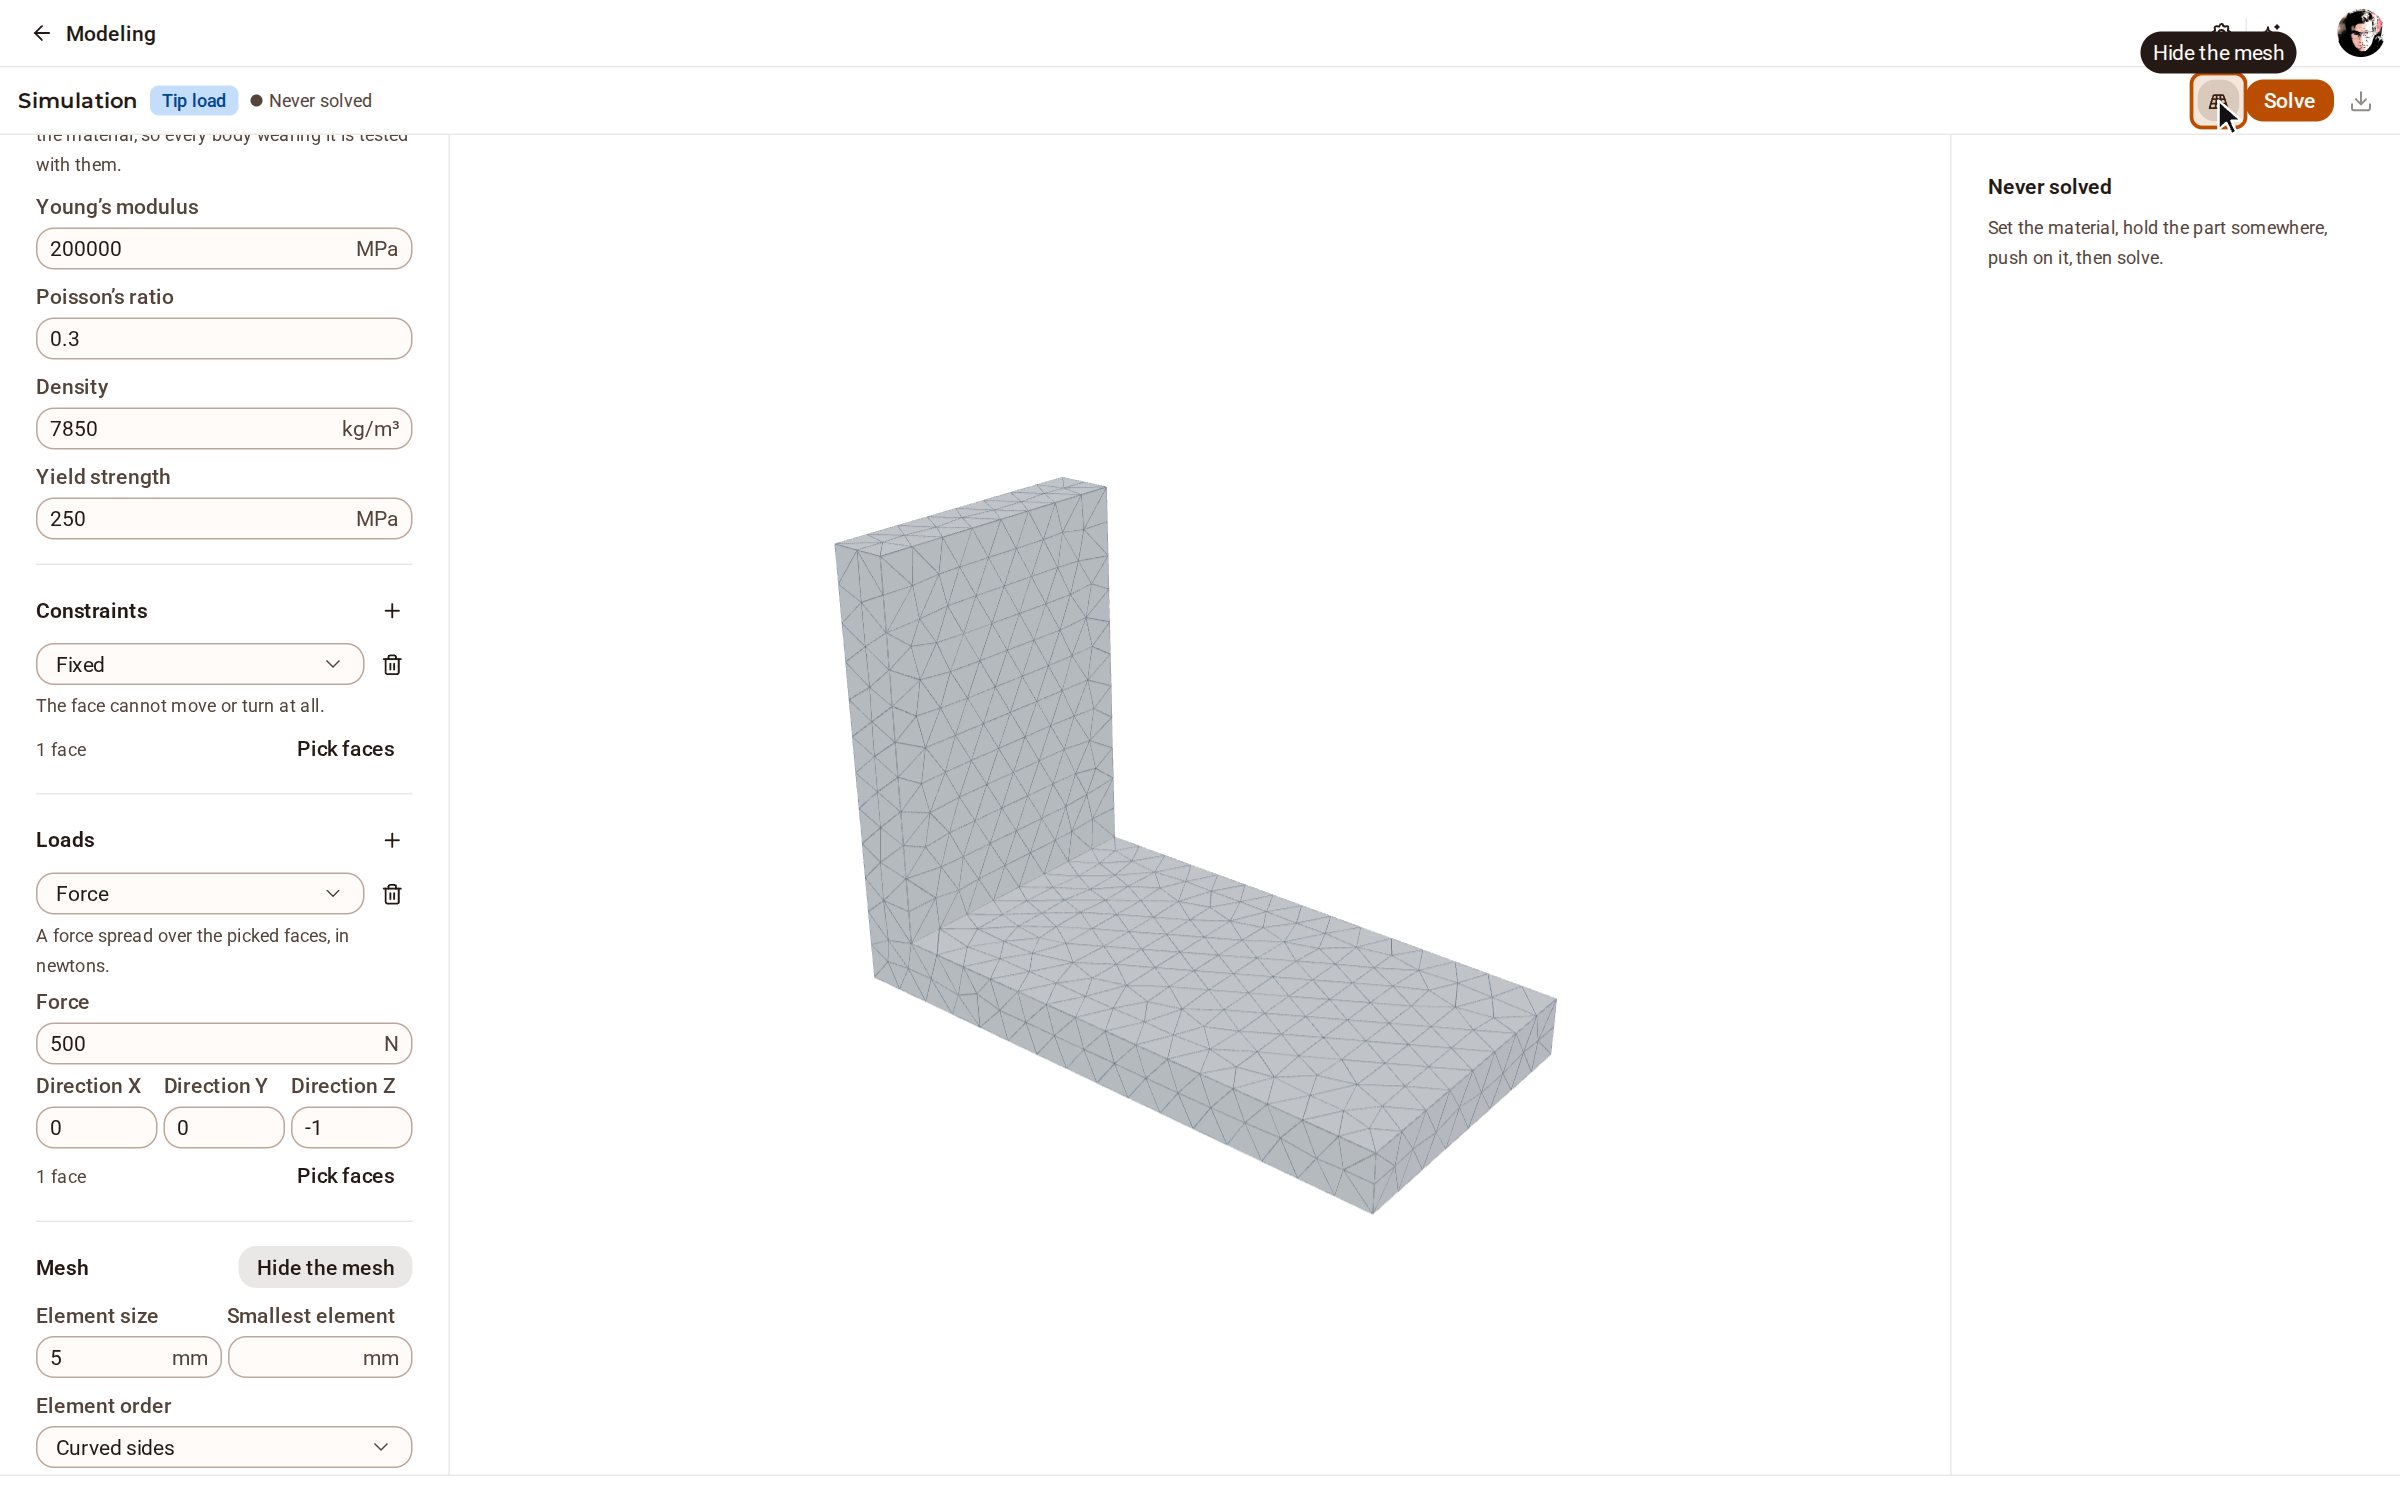
Click Preview the mesh (the grid button beside Solve) to see the elements the part is cut into. Their count and quality are listed under Mesh, further down the setup panel.
-
Click Solve. When it finishes, the part is drawn deformed — exaggerated so the bending shows — and coloured by how far each point moves; Colour by, under Results, picks what the colours show. Results also gives the largest movement, the highest von Mises stress and the lowest safety factor.
Good to know
- Hover over the part after a solve to read the value at that point.
- Export, beside Solve, saves the results as VTK or CSV once the study is solved.
- If the model changes after a solve, the study is marked Out of date: its numbers answer a shape the part no longer has.
- Set Kind to Modal frequencies to find the frequencies the part rings at instead.
Recorded in Kozorosa by the help recorder.